

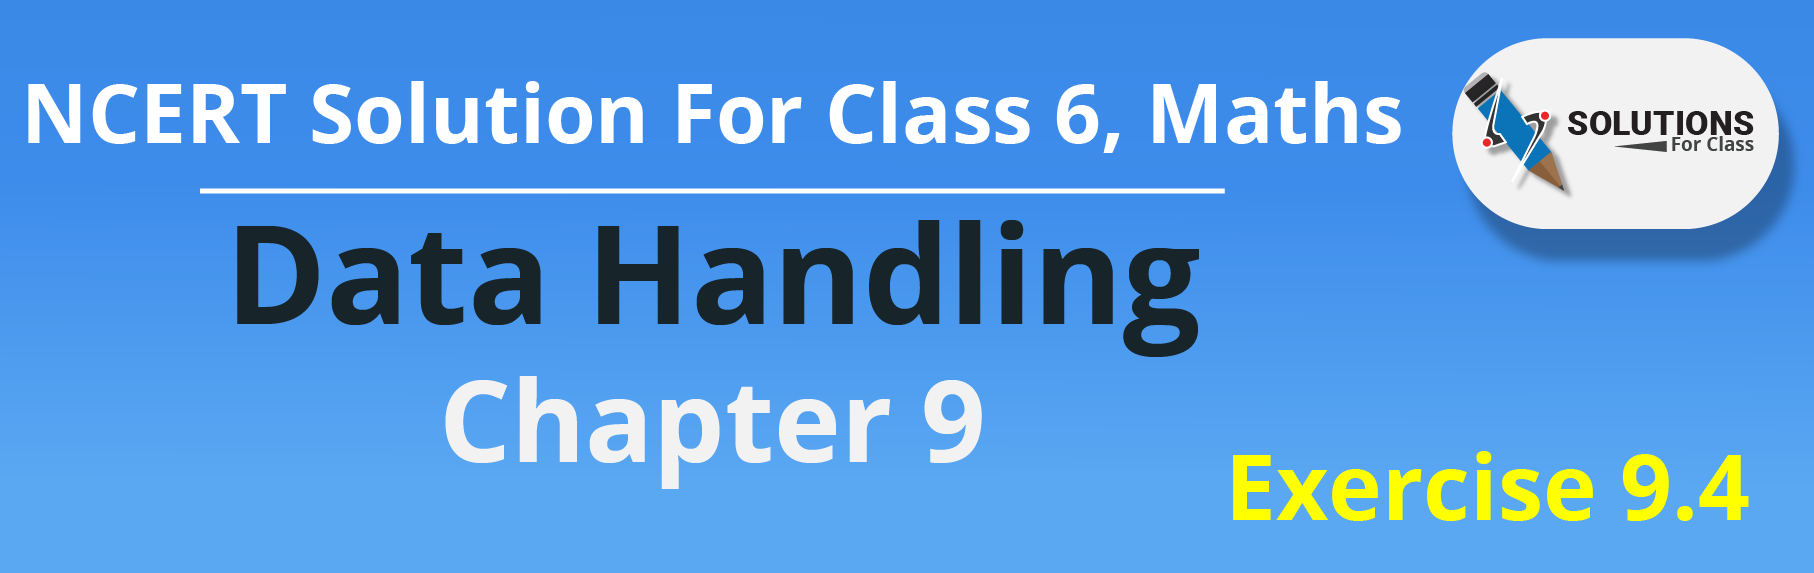
Q.1. A survey of 120 school students was done to find which activity they prefer to do in their free time.
Draw a bar graph to illustrate the above data taking scale of 1 unit length = 5 students.
Which activity is preferred by most of the students other than playing
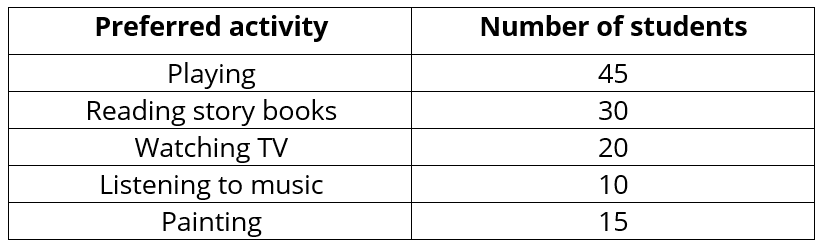
Ans: By taking a scale of 1unit length = 5 students, bar graph is shown:
make same but different.
Reading story books is preferred by most of the students other than playing.
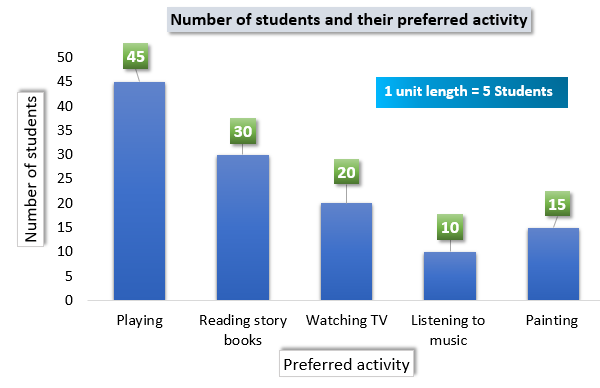
Q.2. The number of Mathematics books sold by a shopkeeper on six consecutive days is shown below:

Draw a bar graph to represent the above information choosing the scale of your choice.
Ans: By taking a scale of 1unit length = 5 books we may draw a bar graph as given below:
Q.3. Following table shows the number of bicycles manufactured in a factory during the years 1998 to 2002. Illustrate this data using a bar graph. Choose a scale of your choice.
(a) In which year were the maximum number of bicycles manufactured?
(b) In which year were the minimum number of bicycles manufactured?
Ans: By taking a scale of 1-unit length = 100 bicycles we may draw a bar graph of above data as follows
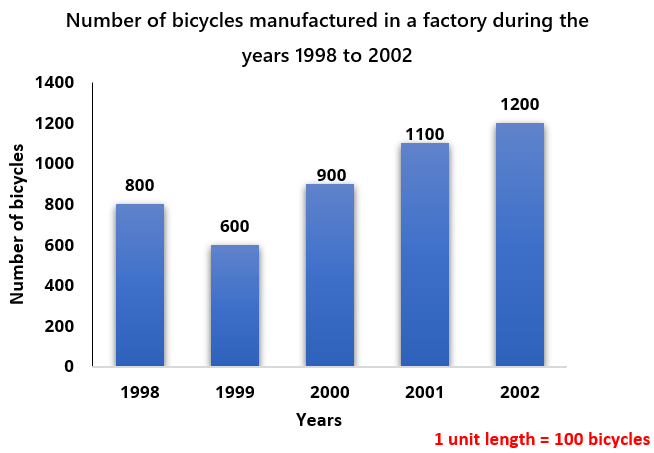
(a) In the year 2002, maximum number of bicycles were manufactured i.e., 1200 bicycles
(b) In the year 1999, minimum number of bicycles were manufactured i.e., 600 bicycles
Q.4. Number of persons in various age groups in a town is given in the following table.

Draw a bar graph to represent the above information and answer the following questions. (Take 1 unit length = 20 thousands)
(a) Which two age groups have same population?
(b) All persons in the age group of 60 and above are called senior citizens. How many senior citizens are there in the town?
Ans: By taking a scale of 1 unit length = 20 thousands we may draw a bar graph of above data as follows
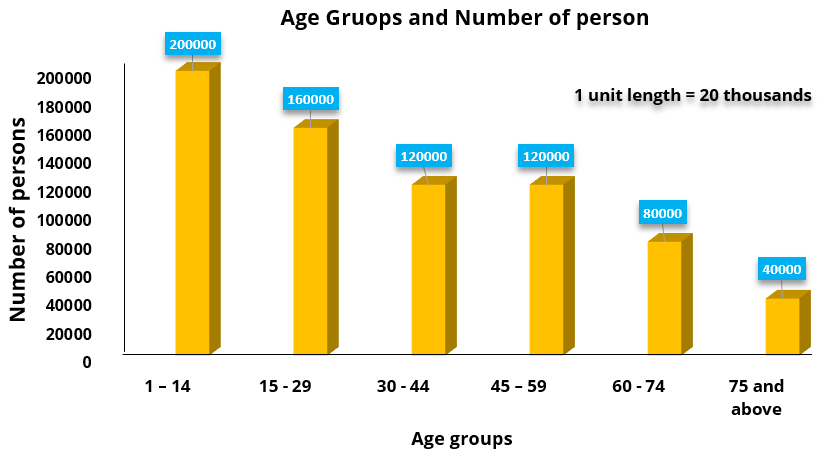
(a) The two age groups which have same population are 30-44 and 45-59.
(b) All persons in the age group of 60 and above are called senior citizens.
Therefore,
Number of senior citizens in the town = 80000 + 40000 = 1 lakh 20 thousand
Hence, the number of senior citizens in the town are 1 lakh 20 thousand.