


Q.1. The bar graph given alongside shows the amount of wheat purchased by government during the year 1998-2002. Read the bar graph and write down your observations. In which year was
(a) The wheat production maximum?
(b) The wheat production minimum?
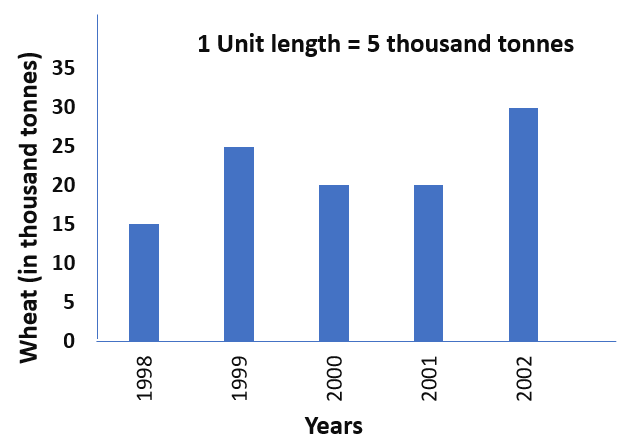
Ans: (a) In 2002, the wheat production was maximum.
(b) In 1998, the wheat production was minimum.
Q.2. Observe this bar graph which is showing the sale of shirts in a readymade shop from Monday to Saturday.
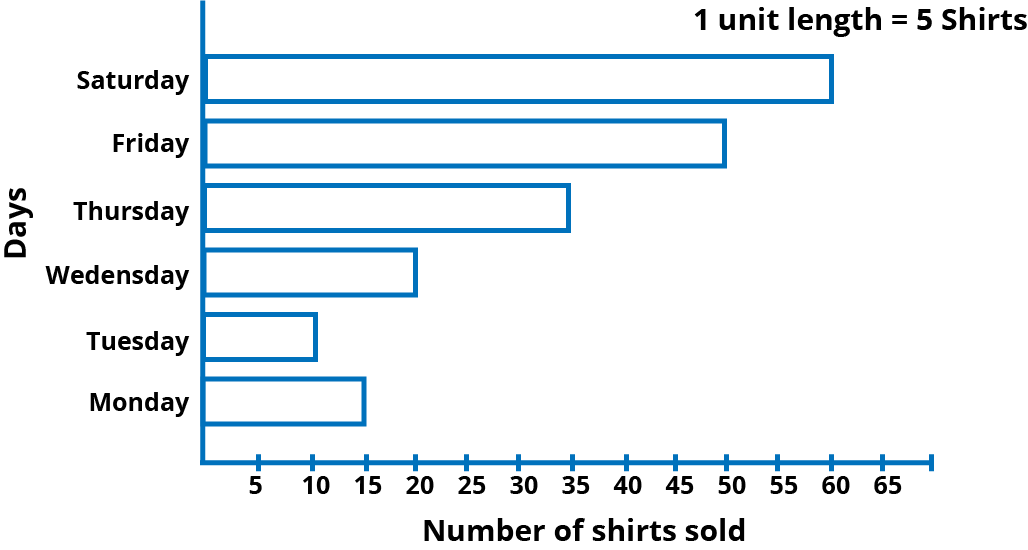
Now answer the following questions:
(a) What information does the above bar graph give?
(b) What is the scale chosen on the horizontal line representing number of shirts?
(c) On which day were the maximum number of shirts sold? How many shirts were sold on that day?
(d) On which day were the minimum number of shirts sold?
(e) How many shirts were sold on Thursday?
Ans: (a) The above bar graph shows the sale of shirt in a readymade shop from Monday to Saturday.
(b) 1unit length = 5 shirts is the scale on the horizontal line representing number of shirts.
(c) On Saturday maximum number of shirts sold i.e. 60 shirts was sold.
(d) On Tuesday minimum number of shirts sold i.e.10 shirts was sold.
(e) 35 shirts were sold on Thursday.
Q.3. Observe this bar graph which shows the marks obtained by Aziz in half-yearly examination in different subjects. Answer the given questions.
(a) What information does the bar graph give?
(b) Name the subject in which Aziz scored maximum marks.
(c) Name the subject in which he has scored minimum marks
(d) State the name of the subjects and marks obtained in each of them.
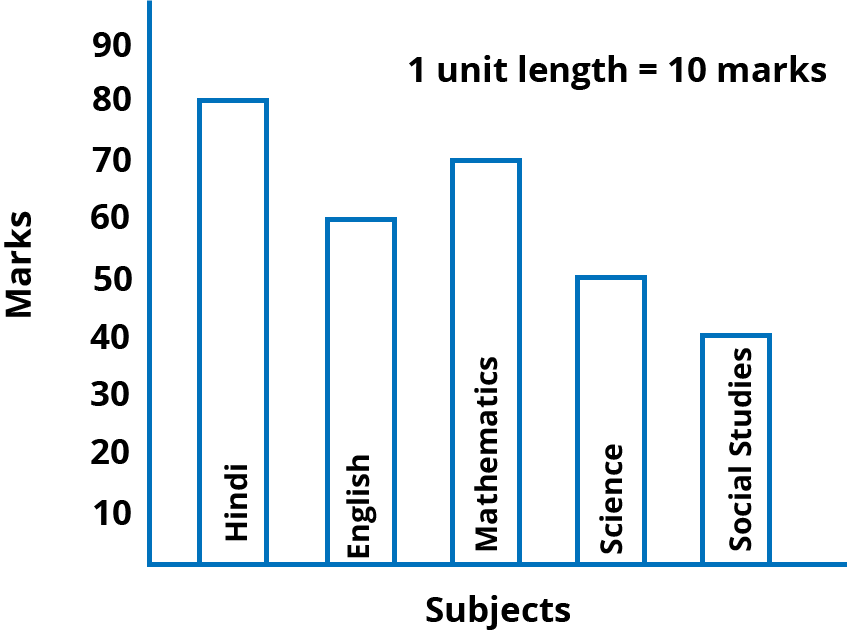
Ans: (a) The bar graph shows the marks obtained by Aziz in half yearly examination in different subjects.
(b) Aziz scored maximum marks in Hindi i.e. 80 marks.
(c) Aziz scored minimum marks in Social Studies i.e. 40 marks.
(d) Hindi 80 marks, English 60 marks, Mathematics 70 marks, Science 50 marks and Social Studies 40 marks.