

Q.1. Total number of animals in five villages are as follows:
Village A : 80
Village B : 120
Village C : 90
Village D : 40
Village E : 60
Prepare a pictograph of these animals using one symbol to represent 10 animals and answer the following questions:
(a) How many symbols represent animals of village E?
(b) Which village has the maximum number of animals?
(c) Which village has more animals: village A or village C?
Ans: We can draw the pictograph for the given data as shown below

(a) There are 60 animals in village E. So, 6 symbols represent animals of village E.
(b) Village B has 120 animals which is the maximum number of animals among these villages.
(c) Village A has 80 animals and village C has 90 animals. Clearly village C has more animals than village A.
Q.2. Total number of students of a school in different years is shown in the following table
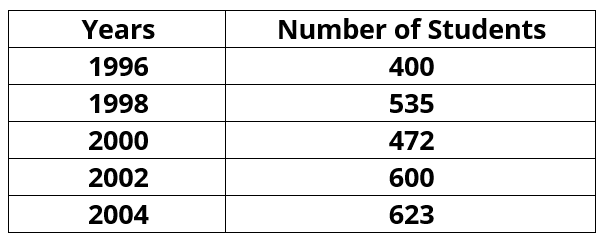
Prepare a pictograph of students using one symbol to represent 100 students and answer the following questions:
(a) How many symbols represent total number of students in the year 2002?
(b) How many symbols represent total number of students for the year 1998?
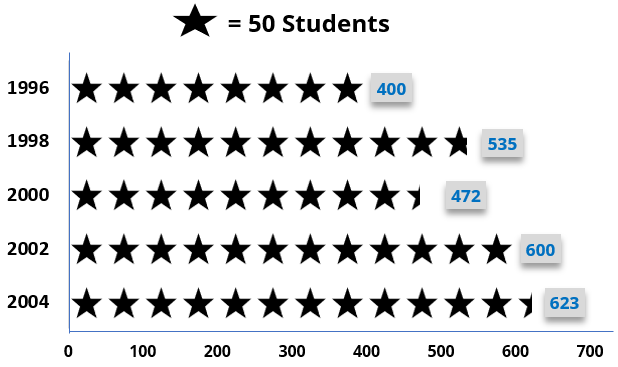
Prepare another pictograph of students using any other symbol each representing 50 students. Which pictograph do you find more informative?
Ans: A pictograph of students using one symbol to represent 100 students
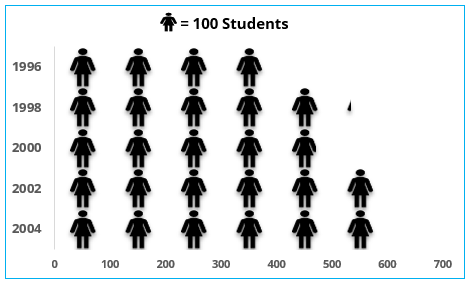
(a) Six symbols represent total number of students in the year 2002.
(b) Five completed and one incomplete student symbols represent total number of students for the year 1998.
B. Pictograph B is more informative than A.